Showing posts with label Traffic report. Show all posts

Thursday, May 10, 2012

QoS Deployments [147]: Telstra Offers Application Aware Control to Enterprises


Telstra announced the " Telstra Application Assured Networking™ service will provide organisations with a clear view and more control over the increasing number of financial, relationship management, IP telephony, video conferencing and other business applications on their network. The new service will initially allow an organisation to produce reports on how networks are being used by applications which can be viewed via an easy-to-use secure online portal on the Telstra Business and Enterprise website. Coupled with this is a consultancy service desk to provide expert advice with regards to application and network performance". (see also "Telstra to Differentiate on Traffic on the Wireline and Wireless Edge" - here). 

Telstra also shows what's next:
  • Manual Policy Control (coming soon)

    The online portal helps you to ensure critical applications perform at peak. Simply use the preconfigured templates to apply bandwidth priority, Quality of Service and service levels to the selected applications. You can also enable blocking policies to restrict unwanted applications on a site-by-site basis.
     
  • Automated Policy Control (coming soon)

    With this enhancement, Telstra’s network will identify applications and apply your specified policies to them. Real-time, application-specific bandwidth bursting and shaping switches the application load as needed. Network resources will be available to help ensure a consistent service and user experience while changes are occurring.

See "Telstra launches network intelligence giving business the complete picture" - here.


Thursday, February 23, 2012

Allot: Mobile VoIP/IM Grow by 114% During H2 2011


Allot Communications published its periodical mobile traffic report showing that "Mobile broadband traffic grew by 83% in the second half of the year with a CAGR of 234% during 2011".

VoIP and video streaming grow above the 83% average (114% and 88%, respectively) - another testimony to MNOs' revenues challenge (more on that - later today). Web browsing and file sharing showed a more modest growth (see chart).

Looking at the share of each application family in total traffic - video streaming leads with 42% share, file sharing is 26%, web browsing 24% and VoIP and IM are 5%.

Later today - how this effects MNOs revenues, what they should do and a related new product announcement.


See press release - "Allot MobileTrends Report H2, 2011 Shows VoIP and IM Traffic Grew by 114%" - here

Thursday, February 16, 2012

AT&T Will Invest $20B in 2012, Focus on Wireless; Mobile Traffic Doubled in 2011

 
John Donovan (pictured), senior EVP, AT&T technology and network operations reports in AT&T's Innovation Space blog that "Running year-end numbers that show the same result as previous years is typically a sign of stability ..But when the year-end numbers show a doubling of wireless data traffic from 2010 to 2011 – and you’ve seen at least a doubling every year since 2007 – the implications are profound .. Over the past five years, AT&T’s wireless data traffic has grown 20,000%".

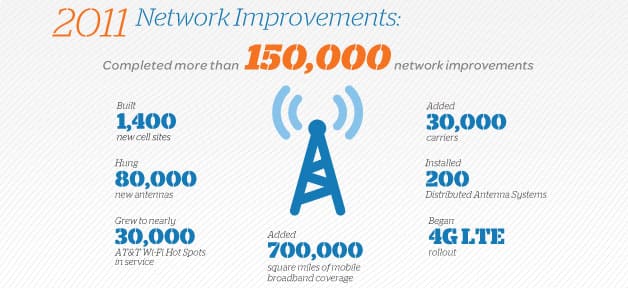
"AT&T has invested more than $95 billion in its wireless and wireline networks over the past five years. In 2011, we invested $20 billion in our networks, and completed more than 150,000 wireless network improvements. And we expect to invest about $20 billion again in 2012 with a focus on wireless, including more 4G LTE deployment, the roll-out of distributed antenna systems in key venues across the U.S. and adding even more AT&T Wi-Fi Hot Spots to the nation’s largest Wi-Fi network."


See "Wireless Data Volume on Our Network Continues to Double Annually" - here.

Wednesday, February 15, 2012

DPI Win: Procera Enforces SLA for Cloud Services in Asia

 
I believe that the following announcement from Procera Networks shows a new direction for the use of application and subscriber-aware traffic management and reporting solutions - managing traffic for "Cloud Services".

While DPI companies sold such solutions in the past (when it was simply called "hosting" or "co-location"), it wasn't a great success. Now, with the popularity of cloud services there is not reason why bandwidth consumption wont be one of the measured and charged items of the service, and traffic will be prioritized based on its business value, the same way storage and CPU cycles are used.
 
Procera announced that ".. it has received and deployed an initial order from a Tier-1 Asian Fixed/Mobile operator for a Cloud Services deployment. This operator serves more than 20 million fixed/mobile subscribers across their coverage footprint, and these cloud services apply to their customers as well as hosting subscribers .. The IPE deployment for the cloud service is focused on enforcing service level agreements (SLAs) for hosting customers and measuring bandwidth usage for billing purposes. Each customer is provided with detailed reports from PacketLogic Report Studio [here] that cover the applications being used to access their hosting service, the traffic load and peak values, as well as the delivered QoE, which can include packet loss on the Internet ".

See "New Tier-1 Asian Fixed/Mobile Operator Selects Procera For Cloud Services Deployment" - here.

Sunday, January 22, 2012

Arbor Networks: How Popular was Megaupload(2)?

   
Jose Nazario, Senior Manager of Security Research, Arbor Networks, helps us to analyze if what " Friends of mine from elsewhere in the world have been joking that the Internet seems to be running a bit smoother today. That may be, given how much bandwidth appears to have been freed up." it true, line Sandvine did 2 days ago (here).
 
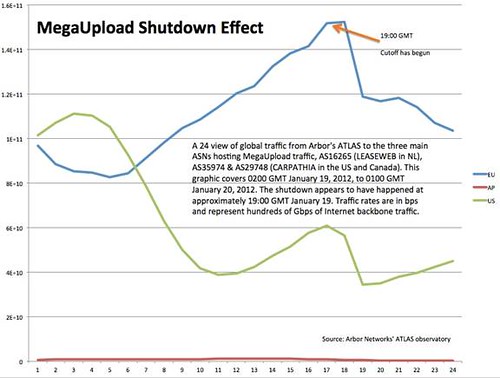
"..  With enough global data, you can actually see the traffic drop when the shutdown occurs. Based strictly on the traffic rates it appears that the shutdown started just after 19:00 GMT on January 19, with traffic plummeting down over the next two hours. The graphic here shows three main client regions – Asia-Pacific, Europe, and the US. Over the past 24 hours, the top countries (in aggregate) using MegaUpload were the United States, France, Germany, Brazil, Great Britain, Turkey, Italy, and Spain, although dozens more countries are represented".

While the Sandvine chart seems to show an immediate drop to 0 bps at time of closure, Arbor shows a slowdown, and even some growth, in the hours following the disconnection. 


See "The MegaUpload Shutdown Effect" -here.

Saturday, January 21, 2012

Sandvine: How Popular was Megaupload?

    
Matt Tooley, VP of Professional ServicesSandvine, published in the company's blog some statistics on the activity of Megaupload, the filesharing (or backup, if you wish) site that was shut down recently (you can see exactly when in the chart below). 
According to Sandvine, Megaupload - "counts for roughly 1% of total traffic on fixed access networks in North America. Also involved in the shutdown were Megaupload’s affiliate sites, which included MegaVideo, MegaPix, MegaLive, and MegaBox"


As many ISPs consider the traffic to these storage sites the same way they were treating P2P file-sharing traffic (i.e. using DPI/throttling to control it). Sandvine was following the traffic in recent years - "The table below shows the combined usage of Megaupload and MegaVideo on fixed access networks in several regions from our Fall 2011 study" 


There are many other options for file-sharing - so this traffic will soon go to other sites. Sorry for those who were really using the service for backup! 

See "Megaupload Gets Shut Down" - here.

Wednesday, December 7, 2011

What Happened when TelstraClear Removed Data Caps?

During the recent weekend, TelstraClear [New Zealand] let its broadband customers to enjoy unlimited service ("unmetered").

This was announced on November 28 (here) saying that "TelstraClear is letting kiwis surf the web, watch video and email to their heart’s content all the first weekend in December. From 6pm on Friday 2 December until midnight on Sunday 4 December, data used by TelstraClear residential broadband customers will be free." 

Well, the weekend is over, and Truenet, a "company dedicated to the accurate measurement and reporting of broadband measurement" shared with the public the results:

"TrueNet analysed the impact on our TelstraClear probes, both Cable & ADSL. The impact was clearly evident, but of little concern, even though TelstraClear National speeds reduced by almost 40% for ADSL customers and 64% for Cable customers .. The charts shows that TelstraClear Cable speeds reduced to almost exactly the same as TelstraClear ADSL speeds. This is what we would expect, ie the speed has reduced to the available capacity, with both technologies having equal access to capacity and thus having equal speeds".

".. TrueNet's interpretation is that TelstraClear's experiment with unlimited broadband was a success with average speeds ranging from 3.3Mb/s to 7Mb/s with a limited number of outages".

TelstraClear was very happy to adopt the above statement. In a press release (here) the ISP said that "Customers used two and a half times more data overall than the previous weekend. Total usage was 359 terabytes (TB), 216 more than the weekend before, and enough to completely fill 216 large computer hard drives".

Steve Jackson (pictured), TelstraClear head of consumer markets, said that "We expected customers to take advantage of this opportunity and were upfront from the start .. We made substantial increases in our national and international capacity before the weekend, and put further capacity in place when the demand exceeded this .. We acknowledge that some customers were unhappy with their internet experience, just as we note that many have reported they didn’t mind slower speeds because they were able to use far more data than they otherwise would"


Monday, November 14, 2011

DPI Announcements: Procera Adds a Network Analytics Reporting Facility

 
Procera Networks announced the "..  availability of PacketLogic Report Studio .. enable network operators to conduct sophisticated analyses on their network traffic for capacity planning, marketing analysis and service planning. Also unique to this solution is that they can turn it immediately into an executive-level, business- and print-ready report. .. PacketLogic Report Studio's sophisticated design and layout engine, however, facilitate the delivery of complex analytics, covering both data gathered by the PacketLogic Intelligence Center and data from external sources, to provide relevant business input to decision makers .. PacketLogic Report Studio is included at no cost with the PacketLogic Intelligence Center and is available now".

"Procera's customers are already using Report Studio to shape their network investments. Example reports that are regularly produced include: Network Usage and Summary Reports, Streaming Video Analysis, Peering Reports and Mobile Device Analytics.

Table 5, extracted from the Netflix example [here], shows usage data with device awareness and QoE ("based on how many packets that are retransmitted to each device due to packet loss in the core and edges of the network")..

See "Procera Unveils Game-Changing PacketLogic™ Report Studio" - here.

Wednesday, May 4, 2011

[update-3] The Royal Wedding Challenge - Extended Report by Sandvine

  
Sandvine published a full report on the global event of the Royal wedding.

The data was collected from "fixed and mobile networks from 5 continents, representing millions of Internet users"  and showed that "during the ceremony itself Internet traffic did briefly exceed normal levels. Immediately after the primary coverage and events ended, traffic dropped to 20% below normal levels, perhaps as many people in the Americas went back to bed after a long night or early morning" (top chart below).

Nevertheless (no surprise here, although the day was a public holiday in the UK so you'd expect majority of people watching it on broadcast TV) - "BBC’s iPlayer streaming increased to 6 times its normal levels around the world. BBC iPlayer is technically only available in the United Kingdom, but diehard royal watchers obviously found mechanisms to get around the restrictions. Looking at Figure 3, the local peaks correspond to the beginning of the ceremony, the carriage ride, and the first kiss" (2nd chart).

Other highlights:
  • Real-Time Messaging Protocol (RTMP) doubled, and global video traffic surged to 26% above normal levels, peaking during the wedding ceremony itself during the wedding ceremony itself
     
  • Traffic on the social media sites Twitter and Facebook peaked 30% and 10%, respectively, above normal levels and local peaks corresponded with highlights of the wedding coverage
     
  • Levels of Octoshape, a proprietary streaming platform used for large-scale online events (most recently President Barack Obama’s inauguration and Michael Jackson’s memorial service) increased 60 times the normal level

Download "Global Internet Phenomena Spotlight: The Royal Wedding" - here (registration required - includes nice pictures on the newlywed couple - but none of Pippa, my favorite character in the event, so I added one). See also Tom's blog post - "Global Internet Phenomena Spotlight: The Royal Wedding" - here.


Friday, April 29, 2011

[update-1] The Royal Wedding Challenge - Who will be the First to Publish Traffic Statistics?

 
Short update to yesterday's post (here) in which I urged the traffic management vendors to track internet use this morning - Sandvine has picked up the challenge. In his yesterday’s blog post, Tom Donnelly (picture) Sandvine's VP, Sales and Marketing promises:
 
 "How many people are going to watch it online and what impact will that have on both fixed and mobile networks?  Over the weekend, we’ll be working hard to crunch the data in order to get a clear picture of where, when, and how viewers experienced the wedding online.  Check back shortly early next week where we will post our full findings in our “Global Internet Phenomena Spotlight: The Royal Wedding”.  Until then, check out these fun wedding stats and enjoy the show!

See "The WWWedding – Global Internet Phenomena?"  - here.

Thursday, April 28, 2011

The Royal Wedding Challenge - Who will be the First to Publish Traffic Statistics?

 
Many of the traffic management and optimization vendors are regularly monitoring internet traffic and publishing reports from which we can learn the recent trends (such as the rise of streaming video). Tomorrow, Friday, is expected to be a special case, as for reasons that are beyond my understanding, billions of people around the world are expected to watch the "Royal Wedding" (a.k.a "William and Kate").

Paul Sonne from the Wall Street Journal provides some technical detials, on the "Internet-friendly event, with a live feed on YouTube and updates via Twitter, Facebook and an official royal-wedding website"

"But Internet services, along with the wedding site and video channel, are sure to be taxed by traffic from as many as 400 million people who could watch the ceremonies online Friday. Roughly two billion people are expected to view them on television .. Google's YouTube is managing the live streaming of the ceremonies on the monarchy's official YouTube channel. Though many online viewers will skirt the YouTube channel and instead visit the websites of broadcasters like the BBC or CNN for a live feed, the wedding could still mark YouTube's biggest live streaming event to date"

"Level 3 a network operator that delivers content across the U.S. and Europe [see "Level 3 vs. Comcast - Charging for Off-Net Internet Video?" - here], is delivering a live feed of the wedding to six major TV broadcasters in the U.S. and Canada, including CNN, and is also serving live Internet feeds of the event across its trans-Atlantic fiber network. Mark Taylor, vice president of content and media, said Level 3 has more than 15,000 servers around the world and delivering the wedding shouldn't be a problem"

See "Internet Providers Ready Receiving Lines for Royal Wedding" - here.

So: Allot (see "Allot: World Cup Generates 26% Increase in Mobile Broadband Usage"- here), Sandvine (see "Sandvine Traffic Report: Mobile Data Patterns Look Similar to Fixed" - here), Bytemobile (see "Bytemobile Forecasts Video to be more than 60% of Total Mobile Traffic in 2011" - here)  -- waiting for your reports!


Wednesday, April 13, 2011

FCC is Asking: "What are the Important Quality Factors in Broadband Services"?

 
The FCC seeks for public commentson the ".. kinds of “need for speed” information that will be most useful to consumers in choosing their Internet service"

The marketplace for broadband service is a confusing one for consumers,” says CGB Bureau Chief Joel Gurin (picture). “Most people don’t understand megabits-per-second in the way they understand miles-per-gallon .. an FCC Survey last year found that 80 percent of people with broadband don’t even know what speed they’re getting from their service. .. This Public Notice will provide a way for internet service providers, the tech community, and the public to help develop clear guidelines that will help everyone understand how to get the service they need.”

See the press release "FCC Bureau Seeks Comment on "Need for Speed" Information for Consumers of Broadband Services" - here and the public notice - here.

"Some applications, like e-mail, are generally not sensitive to network performance. Other applications, such as videoconferencing and gaming, may be affected significantly by a broadband service’s speed, latency, and jitter .. We note that the Open Internet Order [here] requires broadband providers to disclose information regarding network management practices, performance, and commercial terms of broadband services This Public Notice seeks input on the particular types of “need for speed” information that are most useful to consumers"
Well, if people can't understand "bps", how would they resolve of the mystrey behind "Jitter" ?

And indeed one of the questions asked by the FCC is "What is the best way to present information regarding broadband performance needs in a concise, cost-effective manner that facilitates informed consumer choice?" for which the following example is attached to the document (yet still about bps only.. ).


Friday, March 25, 2011

DPI Announcements: Ipoque Adds Reporting Facility

 
Net Reporter Statistics
Source: ipoque
 Ipoque announced the launch of a "..new Net Reporter product for traffic monitoring, reporting and trend analysis. With aggregated, real-time traffic statistics, the system provides detailed and customizable network visibility for all types of access networks right down to the individual subscriber level".
    
See "ipoque Launches Network Statistics and Traffic Analysis System" - here.

A network-level monitoring and reporting tool, with subscriber and applications views, is a basic feature of all DPI/traffic management solutions. Offering from other DPI vendors include Allot's NetXplorer, Sandvine's Network Analytics and Procera's PIC.

Tuesday, February 1, 2011

Cisco: Mobile Data Traffic Nearly Tripled in 2010

 
Cisco published its VNI forecast (see "Cisco Visual Networking Index Forecast Projects 26-Fold Growth in Global Mobile Data Traffic From 2010 to 2015" - here) with tons of information concerning the growth of mobile data. Predicting the future is not easy, as we know, and totaling global traffic is a concept which is not easy to understand - this is why Cisco uses statements like "The updated research projects that annual global mobile data traffic will reach 6.3 exabytes per month, or an annual run rate of 75 exabytes, by 2015. That amount is the equivalent of 19 billion DVDs or 536 quadrillion SMS text messages or 75 times the amount of global Internet Protocol traffic (fixed and mobile) generated in the year 2000".

However facts about the past (i.e. year 2010) are more tangible, and Cisco finds that "Global mobile data traffic increased 159 percent from calendar year 2009 to calendar year 2010 to 237 petabytes per month, or the equivalent of 60 million DVDs" - 2.6X growth is clear even without the DVD illustration.

So I found the following table particularly interesting (taken from "Cisco Visual Networking Index: Global Mobile Data Traffic Forecast Update, 2010-2015" - here):

"Although last year’s Cisco VNI Global Mobile Data Traffic Forecast had projected strong growth in mobile data traffic in 2010 (149 percent), growth was even stronger than anticipated (159 percent). Even more surprising was the strong growth in markets that already had relatively high mobile data adoption and use. For example, last year’s forecast projected 120 percent mobile data traffic growth in Japan in 2010, but we now estimate that the growth was 137 percent. As shown in Table 1, mobile operators and content providers in all regions have continued to report strong traffic growth."


Tuesday, November 23, 2010

Alcatel-Lucent Launches Wireless Optimization Services [w/ Case Studies]

 
Alcatel-Lucent launched "the Wireless Network Optimization Solution, a set of services and software tools based on Alcatel-Lucent’s extensive experience of network management and the modeling abilities of Bell Labs"

See "Alcatel-Lucent launches Wireless Network Optimization solution helping operators manage the mobile data traffic explosion" - here.

A white paper - "Optimization - Secrets to network success: small changes deliver big results" - is available here (see process chart below)

"Alcatel-Lucent optimization experts have conducted over 200 wireless network assessments and optimizations around the world for customers such as Vivacom [Bulgaria], helping network operators to each achieve up to 11 million Euro in savings, and greatly exceed subscriber Quality of Experience expectations". See one of the cases (taken from the white paper) below.


In an interview to the ALU site (here) Christophe Blachier, Practice director for Alcatel-Lucent’s Network Design & Optimization describes the new service:

"..we bring to our service provider engagements over 60 tools built in-house, 20 co-developed with Bell Labs.  With these tools and our team’s expertise we address the four main aspects of optimization: forecasting, real-time monitoring, reporting and analysis.  For example, in our forecasting, we apply advanced methodologies that take into account mobile data impact on networks with bottom-up forecasts based on usage by specific types of devices and applications – rather than just mapping generic data traffic growth.  And not just a fuzzy success but actually helping them [Customers] reach their key performance indicator (KPI) targets by improving end-to-end network QoE, and maintaining customer satisfaction in the face of exploding data traffic, and unpredictable applications on new devices."


Friday, November 12, 2010

Analysys Mason: "The mobile data explosion is a myth"

    
"Mobile network operators can easily meet the demands on their networks at the current growth rates without huge investment in LTE, and could even emerge from the initial phase of market growth with substantially improved revenue-per-byte rates and much healthier margins, states the latest research Analysys Mason 

Measured mobile data traffic growth in Europe is nothing like as fast as ‘doubling every year’, a frequently reiterated claim. Our research indicates that while European mobile data traffic grew by 110% in 2009, it will grow by about 35% in 2010, and that there is no real prospect of a pick-up in growth rates in 2011." 

The US seems to be different - see "CHETAN SHARMA: 2010 Average Mobile Data Consumption to Grow 112% Y/Y" - here).

According to  Rupert Wood, Principal Analyst at Analysys Mason, "Mobile broadband traffic generated by PCs is by far the largest part, accounting for over 90% of traffic, but it is also the part with the slowest growth .. In fact in some markets mobile broadband traffic growth has already come to a standstill ..s ubscriber bases are still growing, but each subscriber uses on average less and less .. The other misunderstood area, according to the research, is the proportion of smartphone-generated data that actually flows over cellular networks .. is actually very low, probably as little as 10–20% in countries where most households have a fixed broadband connection.

See "Weak growth in over-hyped mobile data traffic dampens need for LTE, says Analysys Mason" - here.

Wednesday, October 27, 2010

Cisco VNI: Online Video Overpasses P2P; 1% of Users Consume 20% of Traffic

        
More signs for the decrease in the relative share of P2P vs. online video in broadband traffic are reported in Cisco's latest Visual Networking Index (VNI) report - "Peer-to-peer (P2P) file sharing is now 25% of global broadband traffic, down from 38% last year, a decrease of 34%. While still growing in absolute terms, P2P is growing more slowly than visual networking and other advanced applications.. flash, and Internet TV represents 26%" (see table 1 below).


See "Cisco Visual Networking Index: Usage" - here. See previous posts - here.
An interesting chart (below) reinforces the traditional "20-80" assumption on volume consumption. Top 1% of connection consume 20% (!) of traffic, 10% consume 60%.


Tuesday, October 26, 2010

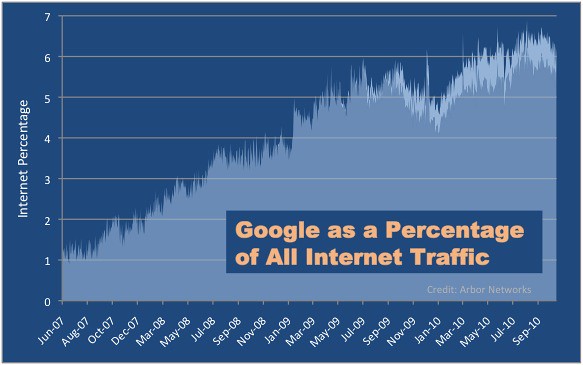
[Arbor Networks]: Google Generates 6.4% of Global Internet Traffic (+caching)

   
A recent post to Arbor Networks (recently acquired by Tektronix Communications - here) blog by Craig Labovitz, provides statistics collected by Arbor's ATLAS project, showing that Google "now represents an average 6.4% of all Internet traffic around the world. This number grows even larger (to as much as 8-12%) if I include estimates of traffic offloaded by the increasingly common Google Global Cache (GGC) [see slide below] deployments and error in our data due to the extremely high degree of Google edge peering with consumer networks"

See "Google Sets New Internet Traffic Record" - here.

"A quick analysis of the data also shows Google now has direct peering (i.e. not transit) with more than 70% of all providers around the world (an increase of 5-10% from last year). In fact, the only remaining major group of ISPs without direct Google peering are several of the tier1s and national PTTs — many of whom will not settlement-free peer with Google due to regulatory prohibitions or commercial strategy."


Tuesday, October 19, 2010

DPI Announcements: Procera Improves Congestion Reporting

    
Procera Networks announced today a new PacketLogic Intelligence Center software version focused on providing visibility into congested situations (links or sites), affected subscribers and the reasons for congestion including applications and devices used.

See "Procera's New PacketLogic Version Delivers Unprecedented Visibility Into Congested Network Behavior" - here and a supporting new blog entry - "Congestion Management and the Heisenberg Uncertainty Principle" - here.

"Some examples of powerful new reports that can be created are:
  • Congestion reports per site based on Quality of Experience (QoE) metrics, traffic dropped, or delay introduced by traffic shaping and/or prioritization, and minutes of congestion for network links
     
  • Number of users affected by Congestion Management -- and to what extent their applications are being affected
     
  • Dynamic consumption reports for subscribers, service plans, locations, applications, and devices
     
  • Popularity and network impact of specific handsets and devices (like iPad) on broadband bandwidth usage
     
  • Number of users relative to amount of bandwidth consumed by emerging killer apps 
Related posts:
  • Cell Congestion Management Solutions from Openet and Sycamore - here
  • Allot Launches CellWise - here
  • Infonetics: Mobile Backhaul - Ethernet vs. Microwave - Market Size - here

Monday, October 18, 2010

Study Shows: Global Broadband Quality Improves by 24% in One Year


Third annual study by a team of MBA students from the Saïd Business School at the University of Oxford and the University of Oviedo's Department of Applied Economics, and sponsored by Cisco, looks at broadband quality in 72 countries and 239 cities and  "reveals continued improvements worldwide, with more countries already prepared for the applications of tomorrow than in previous years and two thirds of the countries analyzed meeting or surpassing today's needs"

See "Third annual broadband study shows global broadband quality improves by 24% in one year" - here
 
Other findings (see more in the presentation below):
  • Mobile broadband quality has improved significantly, with 10% of mobile broadband users already enjoying similar quality experiences compared to those with fixed-line broadband
     
  • The latency of mobile broadband, one of the biggest weaknesses of mobile Internet access, has improved by 45% in just one year, from 1313ms to 724ms. Average download speed is now 936 Kbps, up 35% from 2009 and upload is now 277 Kbps, an increase of over 100% from 2009
     
  • Broadband consumption patterns are diverging, from a basic household requiring over 2 Mbps and consuming about 20 GB per month, to a smart and connected home commanding over 20 Mbps and a consumption of 500 GB per month
     
Professor María Rosalía Vicente, University of Oviedo said "In this third edition we are beginning to see how mobile broadband access is shaping the future of the Internet too. .. more and more people are accessing the Internet through mobile devices, smart phones, tablets, netbooks, and other devices which will connect to the Internet with little or no human intervention. The quality of mobile broadband is growing rapidly and already 10% of users are enjoying comparable quality to that of the fixed broadband users who are ready for "today´s applications".